A topic that has come up for me multiple times recently is how to best measure affinity in retail or eCommerce. In working with customers, I have seen that many different organizations measure affinity differently, and I wanted to take the time to explore the various models and why they may make sense or not. In the end, affinity comes down to probabilities. Before I dive into this, some background (if you already know about affinity analysis, skip below):
What is Affinity Analysis?
Affinity analysis is a measure of the frequency that two items or two sets of items are purchased together. This can either be at the item level, (such as the likelihood that 2 Liter Coke and 3.25 OZ Nacho Doritos are purchased together), or at a higher level in the product hierarchy (such as the likelihood that Shampoo and Condition appear in the same basket). For simplicity’s sake, we will be describing the various affinity analyses using item affinity for the remainder of this post, but the ideas remain the same.
How Can I Use an Affinity Analysis?
- Optimizing promotions: If you find that two items have a strong affinity with each other, it makes sense to only promote one at a given time. Logically, it doesn’t make sense for a grocery store to Hamburgers and Hamburger Buns at the same time, and affinity analysis lets you identify more situations like this
- Optimizing placement: If you have a high margin or very profitable item, such as a brand of bottled water or cereal, it may make sense to promote a more commonly selling item with a high affinity in a nearby endcap, or in a more prominent location in your store. This ideally attracts shoppers to the appropriate aisle or section of your site, where they can see the highly affine item. More simply, you can place items of high affinity next to each other to increase up and cross-sell opportunities.
- Optimizing loyalty: If you have a loyalty card or user account in eCommerce you can tailor circulars and print or e-mail coupons sent to individuals to the items they are most likely to buy based on their historical purchases and item affinity.
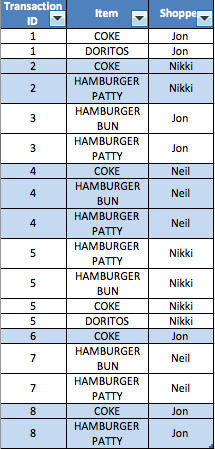
OK, so now that we’ve talked about why affinity analysis can be used, let’s discuss some of the different ways to calculate affinity, using the following mock POS Transaction Detail Table as a example.
Number of Items Sold Together
You can imagine the most quick and dirty way to calculate item affinity would be to calculate the number of times a given item is purchased with another item. This version makes sense at a high level, it allows us to simply see what basket combinations are the most common. In retail sometimes we call this a “Else In Basket” Analysis. Let’s look at the ranking of affinity for Hamburger Patty in this case:
- Hamburger Patty & Hamburger Bun (4 baskets) AND Hamburger Patty & Coke (4 baskets)
- Hamburger Patty & Doritos (1 basket)
If you are looking to answer the question “When people are buying Hamburger Pattys, what else do they buy?” this measure of affinity works well. The next step is taking this information and using it to calculate the percent chance that another item is in the same basket.
Probability of Items Sold Together
Once you know the number of baskets that two items appear together in, you can calculate the likelihood of these items appearing together. This probability question is expressed in mathematics as P(B|A) or the probability of B given that event A has occurred. In this case, if you consider a basket containing Hamburger Pattys to be “B” you are looking at the probability of any item being in a basket, given that Hamburger Pattys are in that basket. Or, P(given item in basket | hamburger patty in that basket).
Probability theory tells us that
P(B|A) = P(A and B) / P(A)
In this case:
P(item in basket | hamburger patty in basket) = P (both items in basket) / P(hamburger patty in basket)
P (both items in basket) = # of times both items appeared in basket / total # of baskets. P (hamburger patty in basket) = # of baskets containing hamburger pattys / total number of baskets.
Let’s take our earlier results and find the likelihood percentages for each item being in a basket with Hamburger Pattys.
Probability of Coke in basket given Hamburger Patty in basket
(4 baskets with both / 8 total baskets) / (6 baskets with hamburger patty / 8 total baskets) = 4/6 = 75%. In other words, if there is a Hamburger Patty in a basket, there is a 75% chance there is also a Coke.
Probability of Hamburger Buns in basket given Hamburger Patty in basket
(4 baskets with both / 8 total baskets) / (6 baskets with hamburger patty / 8 total baskets) = 4/6 = 75%
Probability of Doritos in basket given Hamburger Patty in basket
(1 basket with both / 8 total baskets) / (6 baskets with hamburger patty / 8 total baskets) = 1/6 = 16.66%
Ranked order:
- Hamburger Patty & Coke AND Hamburger Patty & Hamburger Bun (75%)
- Hamburger Patty and Doritos (16.66%)
- Note, the order is the exact same because probability of item being sold together is based directly on “Else in Basket” analysis results.
Deeper Affinity Measure: Lift
Now, you may have a feeling that these analyses don’t give you the full story. Note that there are significantly more Coke’s purchased overall than Hamburger Buns. This should affect our understanding of affinity. Intuitively, you may want to examine how much more or less likely a shopper is to purchase an item given another item in their basket. This nuance is missed in the “Else in Basket” analysis. Instead of looking at the pure probabilities or number of items in both baskets, if you want to understand the affect of overall purchase likelihood you can calculate the affinity by looking at the lift caused by having a given item, like Hamburger Pattys.
To calculate this lift you do:
P(Item in basket | Hamburger Patty in basket) / P(item overall)
We have already calculated the P (item | Hamburger Patty) in the previous section, so all we need to add is P(item overall).
Coke Affinity
P (Coke in any basket) = # Baskets containing Coke / # of total baskets = 6 / 8 = .75
Affinity Lift Analysis = P(Coke in any basket) / P(Coke | Hamburger Patty) = .75 / .75 = 1. In other words, it is just as likely to have Coke in a basket with Hamburger Pattys as it is to have Coke in any other basket.
Hamburger Bun Affinity
P (Hamburger Bun) = # Baskets containing Bun / # of total baskets = 3/ 8 = .375
Affinity Lift Analysis = P(Hamburgen Bun in any basket) / P(Hamburger Bun | Hamburger Patty) = .75 / .375 = (6/8) / (3/8) = 2. This means that you are twice as likely to see a Hamburger Bun in a basket with Hamburger Pattys as in a regular basket.
Doritos Affinity
P (Doritos) = # Baskets containing Doritos / # of total baskets = 1/8 = .166
Affinity Lift Analysis = (1/8) / (1/8) = 1. This means you are just as likely to have Doritos in a basket with Hamburger Pattys as it is to have Doritos in any basket.
Our new ranking of affinity is:
- Hamburger Bun; lift = 2.0. Again, this means Hamburger Buns are twice as likely to be purchased with Hamburger Pattys as in any basket.
- Coke AND Doritos; lift factor = 1.0, as in these items are just as likely to be in a basket with Hamburger Pattys as in any basket.
Summary
As you can see, the way you choose to measure affinity can provide you with a different ranking for the affinity between two items. While the first two measures let you know what ends up appearing in baskets together, the last measure shows you how an item’s presence alters the likelihood of another items in basket. This provides a model for what items drive shopper behavior. In this scenario, the Hamburger Pattys drove shoppers to buy Hamburger Buns, whereas regardless of the Pattys they were likely interested in purchasing Coke.
As a retailer you need to consider what your use-case for a particular affinity analysis is and determine which measure is appropriate to use. When you wish to drive behavior, especially around promotions and item placement, I think the lift analysis must be considered.